偶然间在做项目的时候碰到了小程序需要画图表,图表不用说,直接Echarts。一番搜索,找到了官方提供的echarts-for-weixin,不愧是站在巨人肩膀的开发工程师 😏。
开始
1.把仓库的文件夹ec-canvas放入项目src目录
注意我用的是taro3,"@tarojs/taro": "3.6.8"
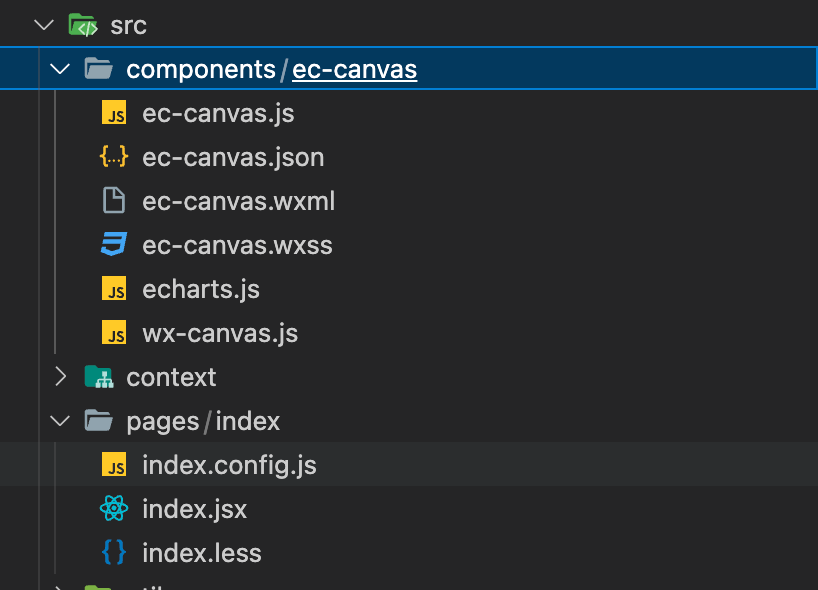
我这里直接放入components目录。
2.在index.config.js文件中引入组件
1
2
3
4
| usingComponents: {
'ec-canvas': '@/components/ec-canvas/ec-canvas'
}
|
3.在index.js使用
1
2
3
4
5
| import * as echarts from '@/components/ec-canvas/echarts'
<View className='canvas-container'>
<ec-canvas id='mychart-dom-area' canvas-id='mychart-area' ec={ec}></ec-canvas>
</View>
|
注意 生成的元素默认是没有高度的,所以要在css中显式的声明高度:
1
2
3
4
| .canvas-container {
width: 100%;
height: 480px;
}
|
然后不出意外的话意外就要出现了!!!⚠️
坑一
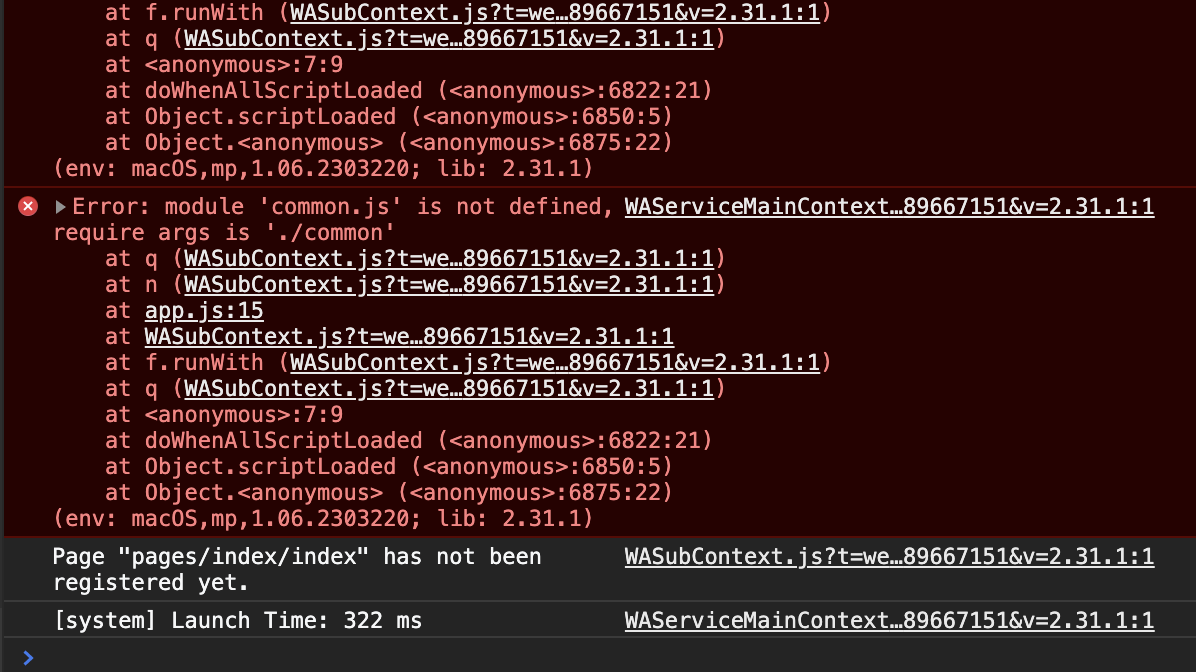
在代码中import * as echarts from '@/components/ec-canvas/echarts'引入echarts就报错,参考这个微信小程序编译后子包内找不到 common.js 文件,手动清理dist等尝试几十次还是报错。
其中skyeryg提到的成功解决。
把common.js改成lib.js或者其他名字就好了,不知道原因。
在config/index.js中,添加下面的代码。
1
2
3
4
5
6
7
8
9
10
11
12
13
14
15
16
17
18
| mini: {
commonChunks: ['runtime', 'vendors', 'taro', 'lib'],
webpackChain(chain) {
chain.merge({
optimization: {
splitChunks: {
cacheGroups: {
lib: {
name: 'lib',
minChunks: 2,
priority: 2,
}
}
}
}
})
},
}
|
坑二
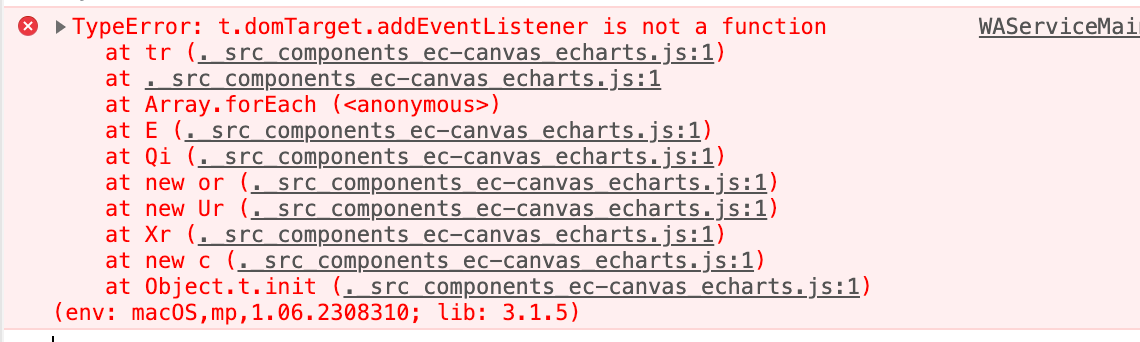
查看未压缩的echarts.js里面
1
| var isDomLevel2 = typeof window !== 'undefined' && !!window.addEventListener;
|
在 taro 3.2.16是false,3.3.2是true
解决:
在不修改Echarts源码的情况下,修改wx-canvas.js,手动补上addEventListener () {}
1
2
3
4
5
6
7
8
9
10
11
12
13
14
15
16
17
18
19
20
21
22
23
24
25
| export default class WxCanvas {
constructor(ctx, canvasId, isNew, canvasNode) {
this.ctx = ctx;
this.canvasId = canvasId;
this.chart = null;
this.isNew = isNew
if (isNew) {
this.canvasNode = canvasNode;
}
else {
this._initStyle(ctx);
}
this._initEvent();
}
addEventListener () {}
getContext(contextType) {
if (contextType === '2d') {
return this.ctx;
}
}
}
|
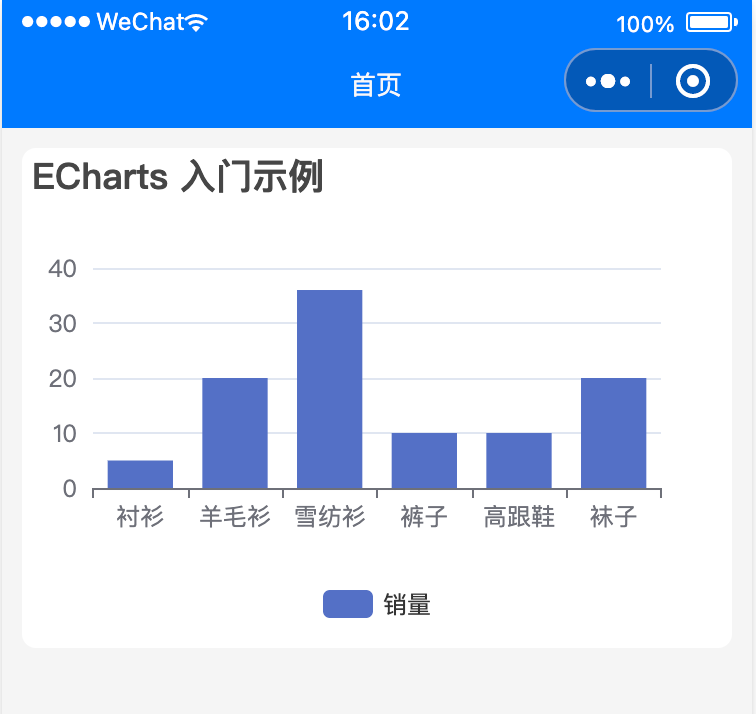
完成
然后终于可以愉快的Echarts了。😀 Echarts官网列子
1
2
3
4
5
6
7
8
9
10
11
12
13
14
15
16
17
18
19
20
21
22
23
24
25
26
27
28
29
30
31
32
33
34
35
36
37
38
39
40
41
42
43
44
45
| export default function Index() {
const ec = {
onInit: (canvas, width, height, dpr) => {
const chart = echarts.init(canvas, null, {
width: width,
height: height,
devicePixelRatio: dpr
})
canvas.setChart(chart)
const option = {
title: {
text: 'ECharts 入门示例'
},
tooltip: {},
legend: {
data: ['销量'],
bottom: 0
},
xAxis: {
data: ['衬衫', '羊毛衫', '雪纺衫', '裤子', '高跟鞋', '袜子']
},
yAxis: {},
series: [
{
name: '销量',
type: 'bar',
data: [5, 20, 36, 10, 10, 20]
}
]
}
chart.setOption(option)
return chart
}
}
return (
<View className='index-page'>
<View className='component-chart'>
<View className='canvas-container'>
<ec-canvas id='mychart-dom-area' canvas-id='mychart-area' ec={ec}></ec-canvas>
</View>
</View>
</View>
)
}
|
优化一下
在不分包的情况下小程序最多2M大小,Echarts一个js就能占1M。
优化1
使用Echart提供的在线定制,只打包自己用到的组件包。
优化2
小程序使用分包,不过有限制,tabbar页面存在图表的话,那你就说服产品把图表放里面页吧。🥱 bye